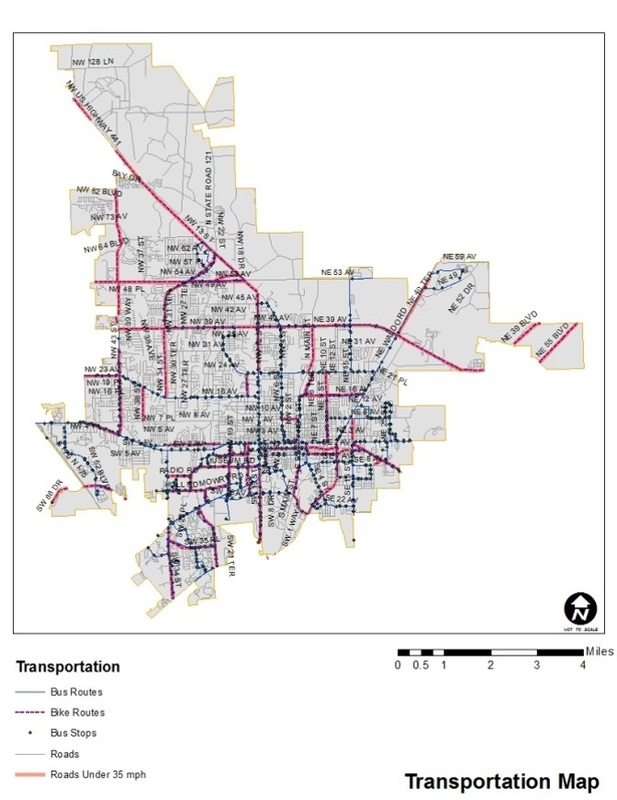
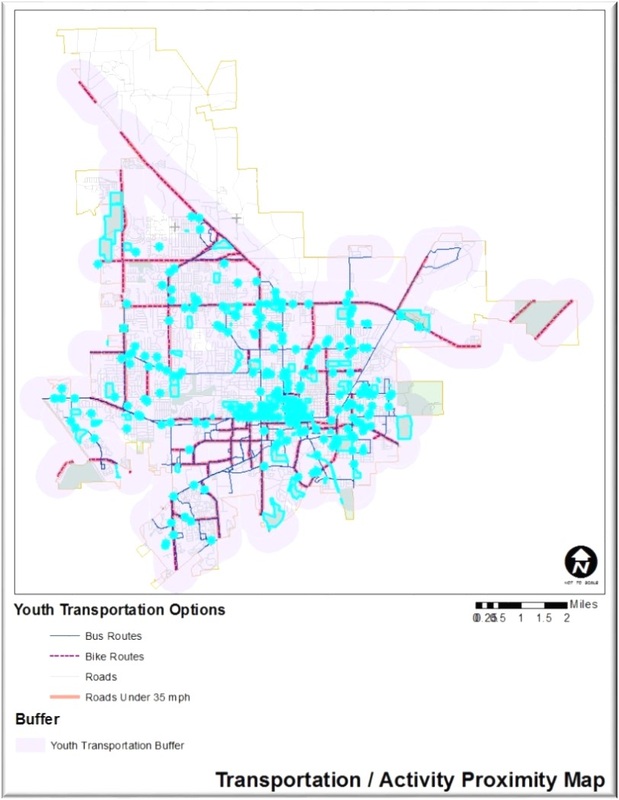

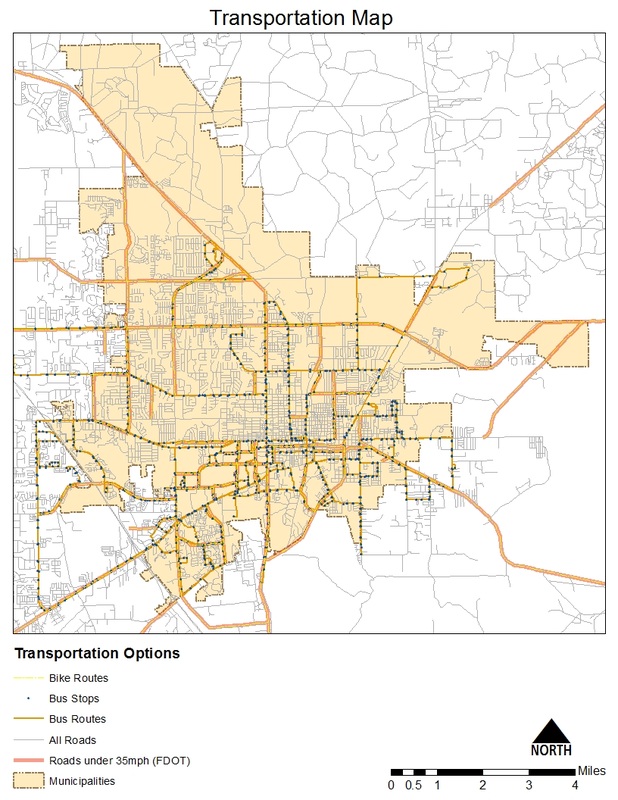
This transportation map highlights the opportunities for children to move independently throughout the city of Gainesville. Bike routes and bus routes will be most valuable to children, as they do not have the ability to drive cars. Roads under 35 mph have been highlighted because the low speed allows a more comfortable pedestrian environment for those traveling along the roadways in modes other than vehicular.
Here is the rough draft as we try to figure out the direction we would like to take some of our ideas and discoveries that we have made as we begin to process the data available to us. There have been many interesting and overlapping correllations which have leads us to broaden the scope of impact we see the data having on a sociological level.
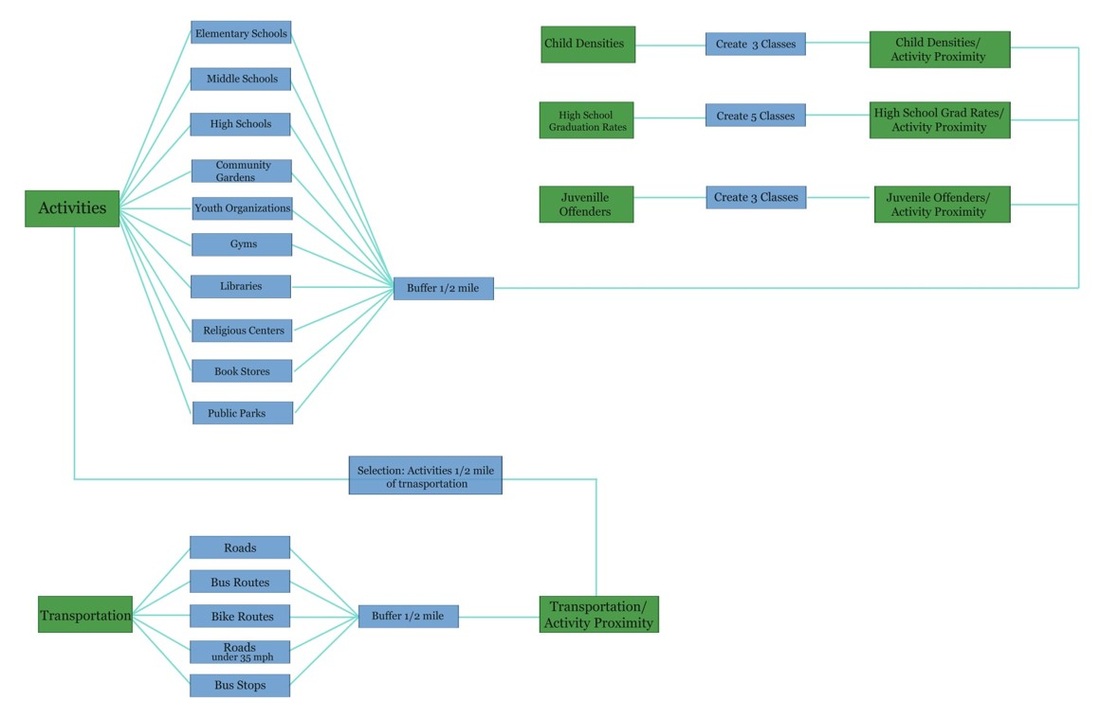
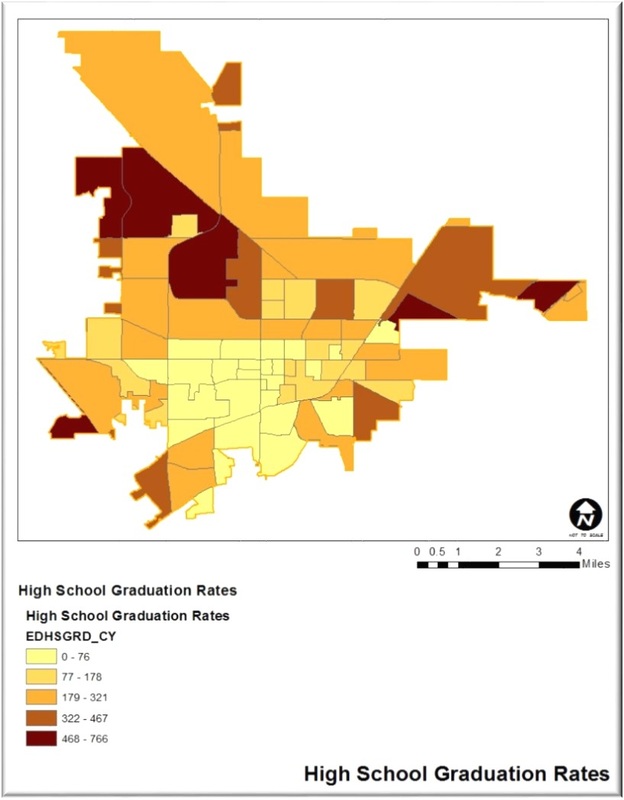
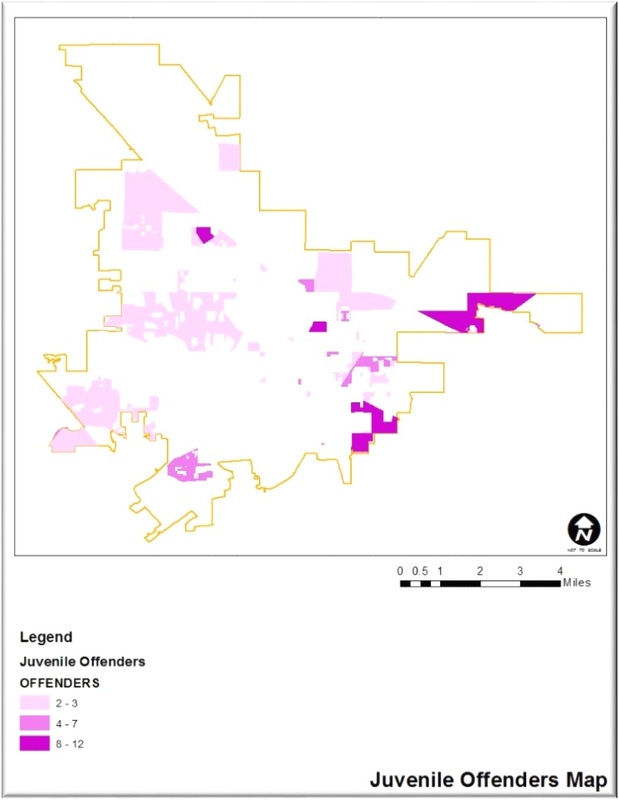
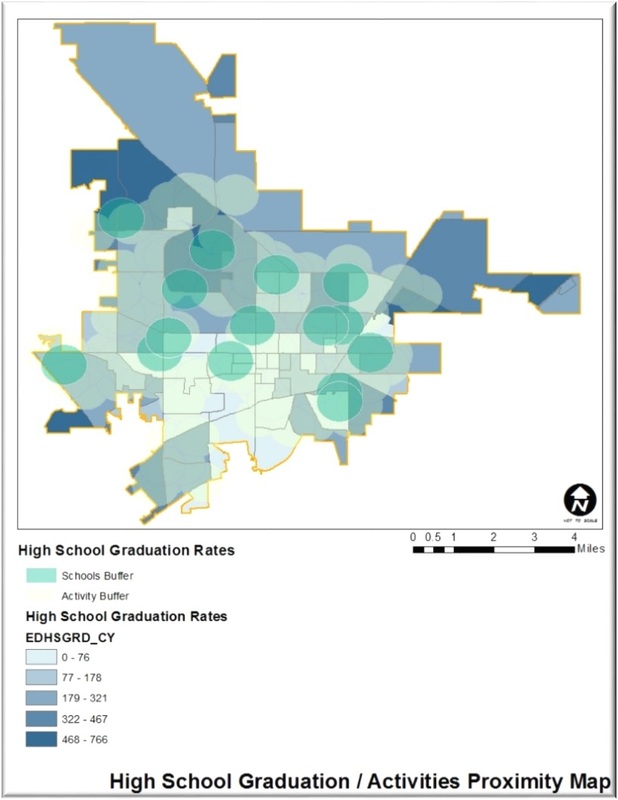
We look forward to any input Main Goal : Identify the available amenities , civic and otherwise, within the Boundaries of the City of Gainesville, , and identify the possible hindrances to making these amenities accessible. for children ages 18 and under Sub Goals: Locate activities Locate Children Identify available modes of transport, bus, bike, walking paths Identify possible hindrances to transport Analyze data to illustrate the successes and shortcomings to child accessibility and independence in Gainesville in order to better understand and overcome roadblocks to child independence within the city. Possible conclusions: no access to resources = low Graduation rate, higher crime etc. Does available transportation actually get used. ? ridership vs available routes Are available resources things people actually want ? programs vs usage Crime rates as hindrance to accessible transit to resources Maps: How access to Transportation relates to Resources/Crime/Graduation rates/ Juvenile Delinquency Distance from public transportation to amenities. IE How long to bus stop and from bus stop act as an obstacle. Crime/safety rates: availability of resources, isolation Density: where the demographic is located, where are the densities of resources Income disparity: access to resources in relation to income level. (note: how to account for wealthier kids using private resources) Isolation factors: lack of connectivity: roads no bike paths: roadaway isolation etc Problem Statement: The environment in which children live, and the access and availability to resources in which to enrich their lives, has a direct impact on their success in life as defined by graduation rates, low crime, etc. Cities often overlook children in the planning process, and lack a comprehensive view when design for social success, by neglecting to provide adequate resources and access to those resources. As a result we believe this ultimately cost the the city financially by increased crime rates and social programs, but robs the community as a whole of the potential these children could bring to the community had they been given the opportunity. ( this kind of includes the million dollar block theory as well, but is that bad? I think its comprehensive and somewhat unavoidable) Our goal is to assess the availability and location of resources and adequate modes of independent transportation to these resources. Once this is evaluated we can begin to understand the other hindrances to these resources, such as crime , inadequate paths etc, in order to understand a relationship between true availability to resources and social success. Scope and Characteristics of Study Area: The project scope consists of the metropolitan area of Gainesville, Florida. The study includes all ages from 0-18. We felt it necessary to include those below the age of 8 as well, in that it gives us a snapshot to what may be available to the next generation of users. We chose to limit our definition of resources given the census data provided to include,libraries, school programs, pools, religious centers, parks, community gardens. We have decided that the criterion for accessibility be defined as location within a half mile buffer of established paths , bike routes, bus routes, and walkable streets ( under 35 and /or adequate sidewalks?). Objectives to reach Main Goal: Identify population centers of our demographic (0-18) minimum of ? per sq mile ? Identify types of resources Identify barriers( crime , accessibility,/etc) Evaluate distance from transport to resources Find correlation between lack of resources and graduation rates/ crime/etc Methodology: Analysis process: ArcGIS Tools applied to solve the problem Describe specific values (variables) that you used. Results and Discussions During our study and analysis, we discovered that there is limited availability of resources available to children under the age of 18 in the Gainesville area. We discovered that there are several impedances to the resources that are available beginning with inadequate transportation, continuing with other isolating factors such as crime and safety concerns that limit the use of what would seem reasonable transportation routes. Also noted that due to the lack of resources and actual use of existing resources, there is a resultant level of crime and low graduation rates in direct relation to areas with the least amount of “actual “ access to such resources. This leads us to beg the question, what are the societal costs we are paying for not providing truly actionable resources to children in need of them? It is not only a moral or sociological factor, but also the societal and fiscal costs. Would it not be better to invest in children, and have them contribute their skills to a productive and integrated society, than to have them become wards of the state, either unemployed, on welfare, or incarcerated? As we begin taking an approach to the data, we are tasked with deciding what we value as the important data. That in turn begs us to ask the question, why do we feel it is important, what informs us that one set of data is more important than the next, and more importantly, would others agrees?
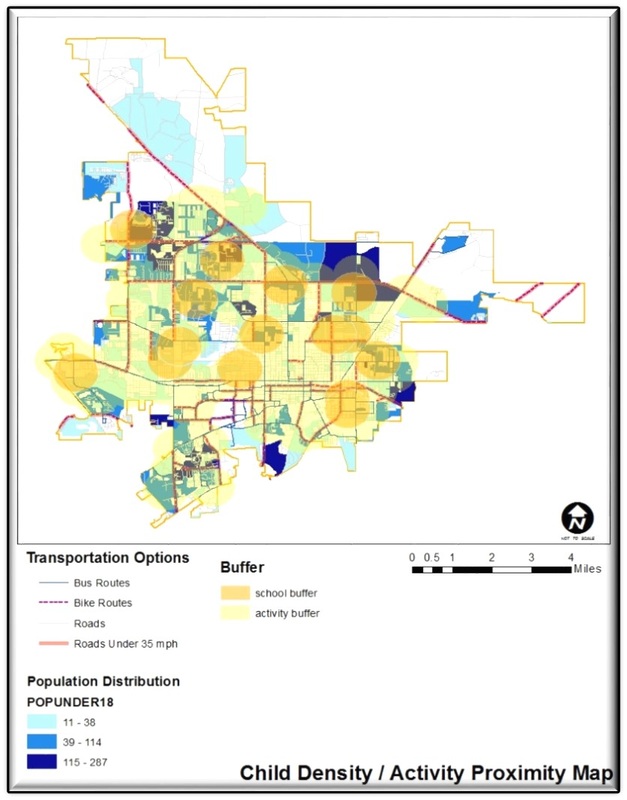
The first thing we decided is identifying our user group. We chose 0-18 as this was the current and most accurate census data available to us. WE then had to decide what we thought were the activites and places we thought should be accessible to these youth. We then overlayed these data sets to discover how proximal to activities the different densities of the user group were. Our next step will be to map out transportation routes and availability and access to transportation to these activiites. For this we will take two or more approaches, one with bus access,another with bike routes/ walkability, and the other with access to a family car or other transport | AuthorWe are Landscape Architecture students at the University of Florida . We created this Blog in order to better understand designing for accessability for our cities youth. As Designers of the Built environment we hope to discover a better awareness of the needs of this underrepresented user group in hopes of providing equal access and opportunity in a safe environment. ArchivesCategories |

 RSS Feed